Most EV owners worry about the battery more than anything else, and most of that worry comes from older claims or from a single unhappy story on a forum. The better question is how much capacity a typical battery actually loses over time, and what changes that number. A large study from Geotab, which tracks data from a large number of vehicles, gives a clearer picture than most of what circulates online.
In this guide we explain the main finding, the factors that move the number up or down, and what the figures mean for a car you own or plan to buy.
Keep in mind that the study reflects averages across many vehicles, so your own result will depend on your car, your climate, and how you charge it.
The headline number
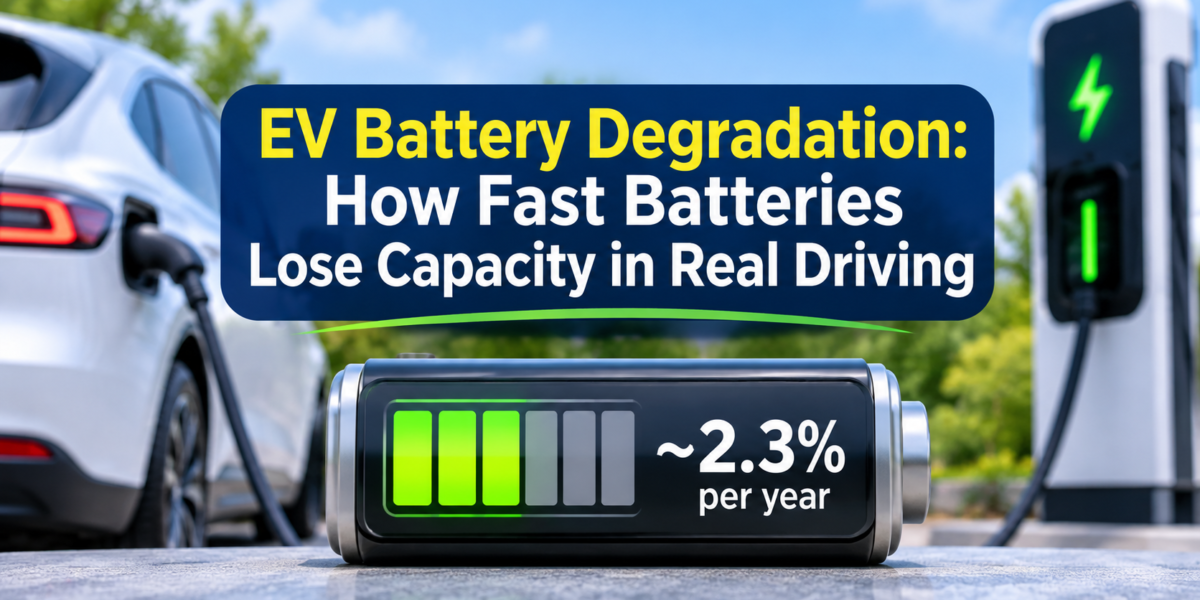
Geotab’s research reports an average battery capacity loss of about 2.3 percent per year. That is an average, not a promise. Some vehicles lose less and some lose more. A figure this size means that after several years, most batteries still hold the large majority of their original capacity, which is far from the failure picture many people imagine.
Read the full press release and the study before you repeat the number in a conversation. A summary article can drop the conditions that matter, and the conditions are where the useful detail lives. The release is available from Geotab’s EV battery health and fast charging study, and an independent write-up of the same findings appears in Electric Autonomy’s coverage of the latest Geotab study.
How charging speed changes the rate
The most useful part of the study is the split by charging power. Geotab’s figures place the yearly loss at roughly 1.5 percent for batteries that charge mostly at lower power, and about 3.0 percent for batteries that charge mostly at higher power. The difference is large enough to matter for daily life.
| Charging pattern | Approximate yearly capacity loss |
| Mostly slower charging | About 1.5% |
| Mostly faster charging | About 3.0% |
| Study average across vehicles | About 2.3% |
Faster charging generates more heat and puts more stress on the cells, which is the most likely reason for the gap. This does not mean fast charging is off limits. Long road trips need it, and a battery that is charged fast now and then will not fail because of it. What the table tells you is that the habit matters more than the single session. A car that you fast charge every day lives in the upper band of that table, while a car you charge at home most nights lives closer to the lower band.
What the first year looks like
Many owners worry most about the early years, when they fear a sharp drop. Geotab’s data includes first-year behavior, and that section is worth reading in the original report, because the early curve is not the same for every car. Check the report for the exact first-year figure before you quote it, and avoid repeating a number you have not confirmed.
What this means for buyers
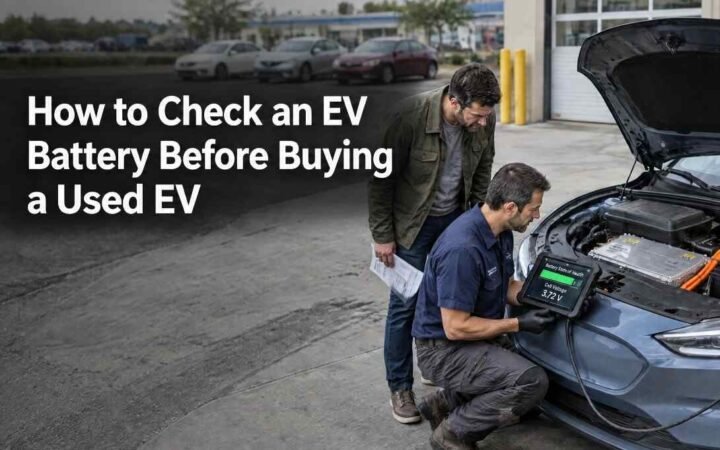
When you compare used EVs, ask the seller for a battery health reading. Many cars show this in the dashboard or through a diagnostic tool. A reading that is close to the expected curve for the car’s age and mileage is a good sign. A reading that is far below it is a reason to ask questions, and possibly to walk away.
Ask how the car was charged, too, if the seller will tell you. A car that spent most of its life on a home charger is likely to look different from one that lived on fast chargers in a city. The difference will not always show up in the numbers, but it is worth knowing.
What this means for owners
If you already own an EV, the most practical lever is your charging routine. Charge to the level you need for the day rather than always to full. Use fast charging when the trip requires it, and use slower charging for everyday top-ups. Keep the battery out of extreme heat when you can, which we cover in our article on hot weather and battery life.
Avoid chasing a battery health number every week. Capacity changes slowly, and a single reading can move because of temperature or the state of charge at the time of the test. Check once or twice a year and watch the trend.
Research note from the EVs-Future team: This guide relies on Geotab’s study and the coverage linked above. The 1.5 and 3.0 percent figures describe averages by charging pattern, not guarantees for any one car. Confirm the exact figures in the original report before you quote them.